Tuesday, January 02, 2024

The 7.5 MM magnitude earthquake off the West Coast of Japan predicted 3 weeks in advance using NASA daily Firemaps.

By Ramaswami Ashok Kumar, B.E., M.E., Negentropist, Bombay Sarvodaya Mandal, 299, Tardeo Road, Nana Chowk, Mumbai-400007.

© 2024 Ramaswami Ashok Kumar

As shown below I forecast the 7.5 MM earthquake off the west coast of Japan 3 weeks in adavnce.

I urge the policy makers to use this approach for saving lives. But since the cause is the World’s dams the solution to avoid such dangers lies in removing the root cause: The dams of the world and use underground water tables to store and distribute  needed water with the help of plants(1).

 The Japan Earthquake 7.5 MM at 710 hrs UTC on 1 Jan 2024.


1. The firemap for past 24 hrs on 8 December 2023 shows the Japan area covering the epicentre of the 1 January 2024 7.5 MM earthquake on the West Coast of Japan a blaze of fires(Covering the East coast of Honshu as well).


2. The firemap for past 24hr for 9th December 2023 shows essentially the same fire blazes covering Japan.


3. The situation of fires blazing is unchanged on 10th December over Japan.


4. The firemap for past 24hrs for 11th December  2023. The epicentre area of the West coast of Japan sees that the heat input into the area by the World’s dams is being used by the soil to liquefy itself!


5. This situation is seen essentially to continue till the earthquake struck the West Coast of Japan on 1 January 2024 at 7:10 UTC: A deep focus earthquake in Fiji two hours earlier saw this forthcoming:

M 4.6 - south of the Fiji Islands

Time

2024-01-01 05:18:59 (UTC)

Location

23.342°S 179.826°W

Depth

533.3 km


6. See for confirmation the firemap for 24 December 2023 for example:


7. Or for that matter the firemep for 15 December 2023:


Thus the firemap forecast this earthquake on the 11th December 2023 itself! A three week advance notice for the World Dam Dynamics caused major earthquake!

References

1. Ramaswami Ashok Kumar. Reforest Mother Earth to Live!

Water, droughts, and floods on the Indian subcontinent:

The naturalecologies solution.

Link: https://practicethevedas.blogspot.com/2008/05/reforest-mother-earth-to-live.html


Thursday, February 23, 2023

The Turkey Earthquake of 7.8 MM magnitude of 6 February 2023 at 1:17 UTC and the World's dams

The Turkey 7.8MM and 7.5 MM earthquakes on 6th February 2023 killed about 50000 lives and was caused by the World’s dams.

By Ramaswami Ashok Kumar,B.E.,M.E., Negentropist, Bombay Sarvodaya Mandal, 299, Tardeo Road, Nana Chowk, Mumbai-400007.

© 2023 Ramaswami Ashok Kumar

0.0 Abstract

The earthquakes of Turkey on 6 February 2023 and the earthquake 67km West of Murghab in Tajikistan on 23 February 2023 were caused by the World’s dams as in the case with most earthquakes in the dam era beginning circa 1900(Ref 1a, 1b, 1c). All the three were preceded by deep focus earthquakes, The Turkey earthquakes were preceded by 3 and a half hours and 3 hours respectively while the Tajikistan's was preceded by 16 and a half hours.  The World’s dams gave at least a day’s notice regarding the Turkey earthquakes to a 17day notice for the Tajikistan earthquake of 6.8 MM magnitude on 23 February 2023.  47 BCM dam content change worldwide during this earthquake generated very high attrition and stresses causing very high shock pulls amounting to thousands of g's and shock input temperatures of 200 billion degrees Kelvin lasting for significant amount of time(seconds) making the rocks to emit white light and lighting up the skies as testified by videos of earthquake lights(EQL) during the earthquake. Thus incandescence of rocks during earthquakes is determined by worldwide dam content change appearing at their centre of gravity and through water moments applied by these changes at the location of the earthquake.  

0.1 Regarding the newsreport:

https://www.thehindu.com/news/international/more-than-7-million-children-affected-by-turkey-syria-quake-un/article66508558.ece

Dams, the root cause of this man-made catastrophe. 

Imperishable is the Supreme. It's location in each individual being is called Adhyatma. The offering in return which causes the genesis and support of life (children) is called karma. How has nature implemented this successfully? The answer: From food creatures become! From rain(not dams) is the production of food. Rain comes from the practice of return. Return is possible only from...karma! Karma is performed with the help of true knowledge. True knowledge comes from Ishwara(God). One of the essences of knowledge is the Gita. Therefore what is returned is the result of true knowledge. Those who disregard and violate this wheel of life so set in motion are living for themselves selfishly( the truth suppressing, false narrative building, human monsters like vile specialist corporations and the quick buck making other people). And will be eliminated by nature. Man is one of the members of nature and not only for man is nature. Reforest Mother Earth to Live. Eliminate dams which are death dealers.

Please specialists have a heart and go through My Complete Profile given in Reference 1 to see how modern civilization is being destroyed by the society of specialists called Modern Civilization itself.

The world has witnessed the false outdated narrative built up without ever mentioning the dam created earthquakes in the dam era: 

1957 September The Nuclear disaster in the Urals because of loss of cooling to nuclear wastes stored at Chelyabinsk due to the world's dams.

1957. October  The Windscale Fire at Sellafield UK

1979. March. Three Mile Island partial core melt by breakfast time.

1986. April Chernobyl

1993. Naroda 220 MW Unit wrecked.

2004. Dec 26th. The 9.1 MM moment magnitude  Andaman Sumatra Earthquake

2007. July  Kashiwasaki Kariwa unit destroyed

2011. March 11. Fukushima Daichi triple core melt and the destruction of the Pacific because of the Tohoku 9.1 MM earthquake caused by the World's Dams. But look at the havoc of infant mortality forecast for India and the World at:

https://livingnormally.blogspot.com/2017/12/dams-caused-fukushima-daichi-to-melt.html

And

Ramaswami Ashok Kumar. 2016. Stop Nuclear Energy Programmes. PROGRESSIVE DETERIORATION OF THE GENE POOL IN THE NUCLEAR AGE at the link:

https://plutoniumaradiumabillionpeoplehitdna.blogspot.com/2016/01/progressive-deterioration-of-gene-pool.html

The tragic history of destruction wrought by dams in the dam era is told throughout the real time on-line book

at Ramaswami Ashok Kumar. 2008. Reforest Mother Earth to Live at the link

https://practicethevedas.blogspot.com/2008/05/reforest-mother-earth-to-live.html

The URL of the book is

https://www.blogger.com/profile/15525366311000374653

1.0The Turkey Disaster caused  by dams

1.0.1 TURKEY 9 hrs after the 7.8 MM quake, a 7.5 MM quake at Ekinozu: Does this not look like a normal fault?

Regarding the video in the following report by Indian Express, the building collapse appears to be due to a normal fault due to the 7.5 MM magnitude earthquake 9 hours after the 7.8 MM earthquake:

https://indianexpress.com/article/explained/explained-sci-tech/turkey-earthquake-measure-magnitude-explained-8426883/

1.0.2 The 7.8 MM magnitude earthquake on 6 February 2023 at 1:17:35.525Z at epicentre at 37.1662,37.0421, depth 17.943 km(Table 1). And the plethora of succeeding quakes there and elsewhere were caused by the world’s dams. Following the discussion in  Reference 1, the occurrence of buildings like the collapsing building shown in the video in the above link is the result of the force and water moment released by some 47 BCM(billion cubic meters) of worldwide dam content changes happening at that instant through the Centre of Gravity of dams at ( 24,97). For a 6600 T building shown in the video, the shock acceleration input given by the force of the 47 BCM dam content change is vertically downwards 70273697.18 m/s/s! The shock temperature input at 2000 J energy input for raising the temperature of the 6600 T building per kg by 1 K  is a staggering 200 billion degrees K(15 million degrees Kelvin is sun's core temperature)! These shock acceleration and shock temperature inputs are representative of the temperatures lasting for a rupture lasting 88 seconds. And also for the 7.5 MM magnitude earthquake that occurred in the vicinity 9 hours after lasting for 37 seconds:

2023-02-06 T10:24:49.258Z Lat            38.0235 Long 37.203 Depth,km 10 Mag 7.5 Mww    

Location: 4 km SSE of Ekinozu, Turkey

  At temperatures which are several times the sun’s core temperature of 15 million degrees C, the rock becomes incandescent and emits light and the whole sky lights up.

But the temperature at which rock just becomes incandescent is about 5000K. So as data furnished in Ref 1c reveals, even a 3.6 MM moment magnitude earthquake showed EQL. The sudden shock input temperature to 6600 T of rock for 3.6 MM earthquake could have been as high as 118412 K which 23 to 24 fold the rock incandescence temperature of 5000 K.

 See the EQL picture for the Turkey 7.8 MM earthquake below:

See https://ddhk.org/en/Lightning-Scientific-Explanation-Appears-During-Turkey-Earthquake/

Dams are the root cause of EQL and associated phenomena!


See Fig 1 for the sequence of events leading to the 7.8 MM magnitude earthquake.

See Fig 2 for the estimate of Ground Failure, landslides and Fig3 for the estimate of liquefaction as per USGS.

Fig.1. As the vector of sudden water moment changes caused by the world’s dam contents moved from the earthquake at Peurto Rico to the Earthquake in central Turkey, it found fulcrum at the location of the 7.8 MM magnitude earthquake near Nurdagi. In the dam era, a plethora of earthquakes occur all round the centre of gravity of the World’s dams at 23.74, 97.19 as the USGS plot of earthquakes for the past 30 days shows. The sum of the dam content changes at any instant acts at its center of gravity (red star), vertically up in the dry season( October to May) and at the hypocentre of the earthquake in the vertically downward direction(normal fault). In the rainy season the fault is a thrust fault for earthquakes caused by dams.


Fig2 Landslides due to 7.8 MM magnitude earthquake of Fig1. Source USGS Significant earthquakes 2023.


Fig.3 Ground liquefaction probability of 7.8 MM magnitude earthquake at Turkey which killed about 50000 people and a million people displaced. Source: USGS Significant Earthquakes 2023.


Fig.4 The plethora of dams in the dam era till the present (www.nature.com)


See Reference 2 of the havoc of extremes created by the dams.
Table 1: for estimating vertical ground motion accelerations and shock input temperatures.


The groundwork of earthquakes and hotspots created the situation ripe for the major earthquakes on  6th February 2023.
Let us check out the hotspots created by the world’s dams by direct heating up of the earth as revealed by the FIRMS World Daily Firemaps. 
The hotspots are considered in an area enclosing roughly Turkey and Syria as given by the latitude and longitude limits  Latitude >=31.5, <=41.75; Longitude >=25.775, <=44.674.
The hotspots on 2 February 2023 created by the World’s dams directly heating up the earth: There are 122 hotspots in the Turkey- Syria area:


On the 5th February 2023 see the dramatic reduction in the number of hotspots to only 22. In fact considering only Turkey, the number of hotspots are practically zero. But it is a deception. The World’s dams are busy melting the earth below Turkey by supplying the Latent heat of fusion of rock to the ground. A dire warning of the major earthquakes and a strong earthquake to hit Turkey on 6th February. Almost a 12 to 24 hr fore-warning.


See the hotspot picture for the globe on 6th February 2023: Turkey is to the naked eye devoid of hotspots! No. It is latent heat of fusion being supplied by the World’s dams in the process of creating the major earthquakes of 7.8 MM and 7.5 MM moment magnitude earthquakes (cf Fig. 1).  Three and a half hours prior to the 7.8 MM earthquake also a deep focus earthquake occurred confirming that this earthquake was to occur! Similarly some three hours 23 minutes before the 7.5 MM earthquake at Ekinozu a deep focus earthquake gave a fore-warning.


The deep focus earthquake before the 7.8 MM earthquake was:
2023-02-05T21:40:40.408Z Lat 18.3847 Long 145.3101 Depth, km 538.6 4.3 mb 57 75 4.787 0.36 us us6000jll6 2023-02-05T22:17:07.040Z Pagan region, Northern Mariana Islands. 
And that before the 7.5 MM earthquake was
2023-02-06T07:11:34.556Z -7.6034 117.1582 343.249 4.9 mb

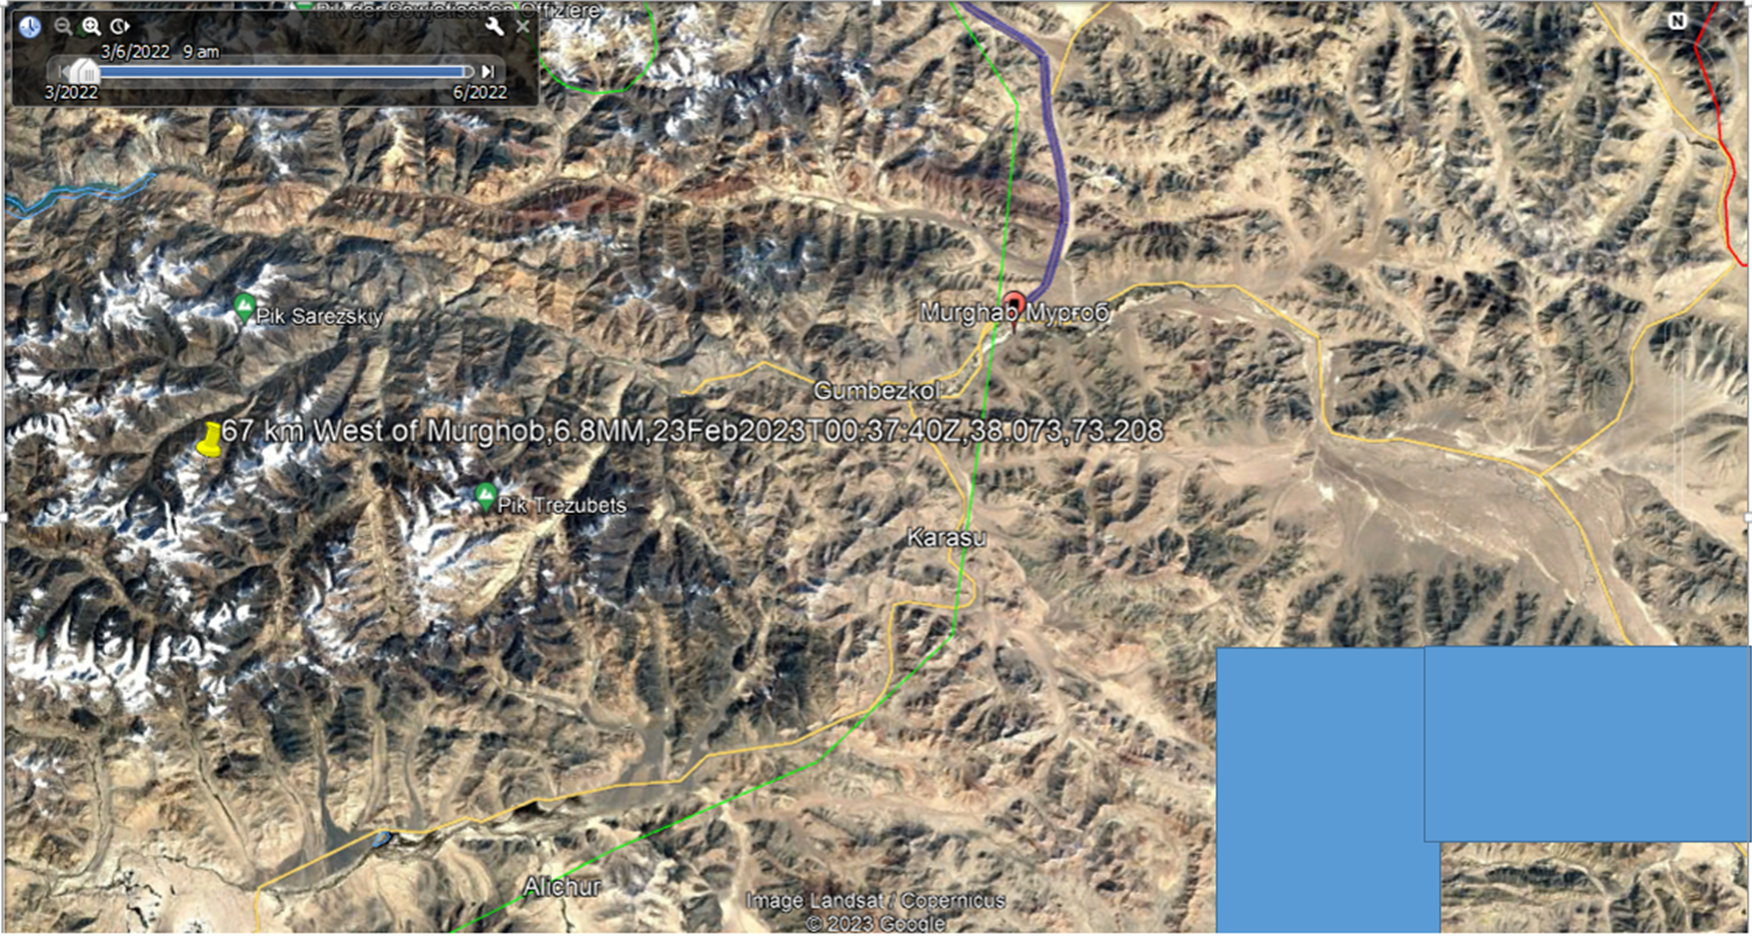
7.0 A similar situation led up to a 6.8 MM magnitude earthquake 67 km west of Murghab, Tajikistan. See the Google Earth Pro picture:


8.0  The melting of the earth under Tajikistan and the run up to the earthquake on 23 February 2023 is depicted in the FIRMS Daily Fire Maps from 2nd February 2023 till 27th February 2023:
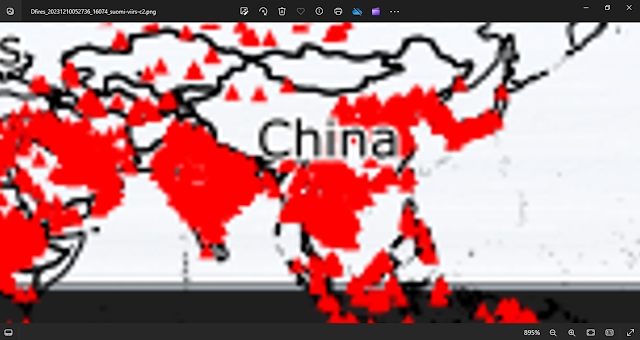
8.1    Worldwide Hotspots on 2 Feb 2023


8.2   Worldwide hotspots on 5 Feb 2023. The left arm of Tajikistan shows hotspots, while the right arm containing Murghab shows no hotspots; it is being supplied by the dams with latent heat of fusion of the rocks underneath. The ground under Turkey also is melting as shown by the almost complete absence of hotspots. 


8.3   Hotspots on 6 February 2023, the day of the 7.8 and 7.5 MM magnitude earthquakes. Note the complete absence of hotspots in Turkey and in the right arm of Tajikistan containing Murghab. The world dam dynamics are causing the melting of the earth under Turkey and Tajikistan on the Murghab side by the input of Latent Heat of Fusion of the rocks. A 17day warning had been issued by the World’s dams that Tajikistan is going to have strong or greater earthquake!


8.4  Hotspots on 7 February 2023. The earthquake of 23 February 2023 in Tajikistan is developing.


8.5 Hotspots on 8 February 2023. In view of the earthquake of 6.8 MM magnitude on 23 February 2023 in Tajikistan, clearly the ground underneath Tajikistan is being heated to melting point and beyond by the World’s dams supplying Latent Heat of Fusion of the rocks and more.


8.6 Hotspots on 9 February 2023. Tajikistan is melting beneath the ground.


8.7 Hotspots on 10 February 2023. Murghab side of Tajikistan continues to be melted.


8.8 Hotspots on 11 February 2023. A continuation of melting of the Murghab side of Tajikistan.


8.9. Hotspots on 12 February 2023. The melting of the ground beneath Tajikistan is about to be suddenly expanded into the whole of Tajikistan as can be seen by the shifting of the hotspots on the Dushanbe side, to make the whole of Tajikistan devoid of hotspots recognisable from the satellite.


8.10 Hotspots on 13 February 2023. Tajikistan is melting beneath the ground as the complete absence of hotspots detectable by the satellites shows.


8.11 Hotspots on 14th February 2023. The ground underneath continues to melt in Tajikistan.


8.12  Hotspots on 15 February 2023. Tajikistan continues the melting of rocks beneath the ground.


8.13  Hotspots on 16 February 2023. Rocks continue to melt beneath the ground in Tajikistan


8.15  Hotspots on 18 February 2023. The melting of rocks is partially over.


8.16  Hotspots on 19 February 2023. Hotspots are visible almost in the whole of Tajikistan again.


8.17  Hotspots on 20 February 2023. Latent Heat of Fusion has been delivered again by the World’s dams on the Murghab side of Tajikistan and the Murghab ground is melting again.


8.18  Hotspots on 21 February 2023. Massive hotspots to the left of Murghab side of Tajikistan  and the dams applying enough heat causing the rocks to melt: complete absence of visible hotspots in the Murghab side.


8.19  Hotspots on 22 February 2023. Murghab under ground melt. Imminent earthquake:


8.20  Hotspots on 23 February 2023. Earthquake:
2023-02-23T00:37:40.397Z 38.0726 73.2077 20.522 6.8 mww
67 km W of Murghab, Tajikistan
A forewarning of this earthquake was given 16 and a half hours before by a deep focus earthquake in Fiji:
Fiji region 2023-02-22T08:04:14.054Z -20.4986 -177.612 520.122 4.8 mb 
Note that Murghab continues to melt as shown by the southern side of Murghab region of Tajikistan!
Note that where the earthquake occurred the incipient melting caused the hotspots to vanish into the Latent Heat of Fusion of the rocks below the epicenter.


8.21  Hotspots on 24 February 2023. The melting of the ground underneath Tajikistan is in full swing!


8.22  Hotspots on 26 February 2023. Hotspots as seen by satellite absent in Tajikistan, yes- absent!


8.23  Hotspots on 27 February 2023. Hotspots in Tajikistan started arriving again!


9.0 Inferences and Conclusions
The hotspot picture shows that both the Turkey earthquakes and the Murghab earthquake at Tajikistan CAUSED BY THE WORLD'S DAMS were predicted days before the occurrences. In particular the Turkey earthquakes were predicted at least 12 to 24 h before and the Murghab earthquake in Tajikistan a good 17 days before! The precautionary principle was applied in making the above inferences but sticking to public interest science principles. In all probability deaths could have been drastically reduced.


2.0 References

1a. Ramaswami Ashok Kumar.2006. Earthquakes caused by dams. At the link

https://earthquakescausedbydams.blogspot.com/2006/07/title-earthquakes-caused-by-dams.html

1b. Ramaswami Ashok Kumar. 2015. Predicting Earthquakes: The science of dams causing earthquakes and climate change at the link:

https://predictingquakes.blogspot.com/2015/04/the-science-of-dams-causing-earthquakes.html

1c Robert Thériault, France St‐Laurent, Friedemann T. Freund, John S. Derr; Prevalence of Earthquake Lights Associated with Rift Environments. Seismological Research Letters 2014;; 85 (1): 159–178. doi: https://doi.org/10.1785/0220130059

1. Ramaswami Ashok Kumar. 2021. PERFECT DESIGNS: 1000 one megaton thermonuclear bombs exploding and pandemics like COVID 19 - the consequence of world dam dynamics. Heed! At link:
https://livingnormally.blogspot.com/2021/12/1000-one-megaton-bombs-exploding-and.html
1a. 
2. Ramaswami Ashok Kumar. 2016. PERFECT DESIGNS. The average happiness created by the dams of the world is zero: They are extinction breeders. Replace them with forests. The link:
https://livingnormally.blogspot.com/2016/05/the-average-happiness-created-by-dams.html


Tuesday, June 28, 2016

PREDICTING DAMQUAKES-5

Copyright © 2017 Ramaswami Ashok Kumar

Latest News


06-05-2017 12:35 UTC


The hotspots in North India may be precusor to a mighty earthquake in the Himalayas during May 2017:


Total number of fires detected : 5426
[ONLY TOP 5 RESULTS ARE SHOWN.]

LatitudeLongitudeDateTimeBrightnessConfidenceScanTrackSatelliteVersionBright.T31FRPDayNightType
 33.13933  74.15773    2017-05-06    08:24    341.4   nominal    0.6  0.4    N    1.0NRT    309.3    6.2    D 
 32.64139  71.4679    2017-05-06    08:24    347.9   nominal    0.4  0.4    N    1.0NRT    316.5    31.8    D 
 32.63789  71.46852    2017-05-06    08:24    349.1   nominal    0.4  0.4    N    1.0NRT    316.9    16.7    D 
 32.63382  71.46456    2017-05-06    08:24    348.0   nominal    0.4  0.4    N    1.0NRT    316.8    17.4    D 
 32.6344  71.46915    2017-05-06    08:24    346.9   nominal    0.4  0.4    N    1.0NRT    316.9    16.7    D 

4 May 2017 13:27 UTC
A deadly consequence of dam surges awaited in South East China?
See hotspot count:
Total number of fires detected : 6107
[ONLY TOP 5 RESULTS ARE SHOWN.]
LatitudeLongitudeDateTimeBrightnessConfidenceScanTrackSatelliteVersionBright.T31FRPDayNightType
 18.97496  104.30216    2017-05-03    05:54    345.3   nominal    0.5  0.4    N    1.0NRT    292.2    29.1    D 
 18.14735  100.00971    2017-05-03    05:54    351.0   nominal    0.3  0.6    N    1.0NRT    294.0    4.6    D 
 18.47357  101.55989    2017-05-03    05:54    338.1   nominal    0.5  0.5    N    1.0NRT    294.7    73.6    D 
 18.4726  101.55495    2017-05-03    05:54    346.5   nominal    0.5  0.5    N    1.0NRT    302.3    73.6    D 
 18.23207  100.34786    2017-05-03    05:54    338.3   nominal    0.6  0.6    N    1.0NRT    288.8    7.2    D 


Peak Magnitude earthquake in May 2017:
Prediction:
7.7 MM between 13th May and 20th May 2017 in the hotspot region indicated in the table above.

26 April 2017
An earthquake imminent in Mexico? See hotspot count :


Melting of rocks and the dynamics of dams goes on.


Total number of fires detected : 4402
[ONLY TOP 5 RESULTS ARE SHOWN.]

LatitudeLongitudeDateTimeBrightnessConfidenceScanTrackSatelliteVersionBright.T31FRPDayNightType
 20.31421  -88.83135    2017-04-26    20:00    330.4   nominal    0.7  0.8    N    1.0NRT    298.0    5.1    D 
 20.34927  -88.39624    2017-04-26    20:00    338.6   nominal    0.7  0.8    N    1.0NRT    293.7    8.9    D 
 20.32244  -88.73037    2017-04-26    20:00    367.0   nominal    0.7  0.8    N    1.0NRT    303.0    43.2    D 
 20.35698  -88.20711    2017-04-26    20:00    330.2   nominal    0.7  0.8    N    1.0NRT    294.4    6.0    D 
 20.37141  -88.02053    2017-04-26    20:00    367.0   nominal    0.8  0.8    N    1.0NRT    296.2    30.0    D 

7 April 2017 08:11 UTC
The peak magnitude damquake for April 2017 is expected to be  of moment magnitude 7.6 -8.1 MM and to occur between 14 and 21 April 2017. The candidate locations are the Colombia, Western Central Africa, the Himalayas, Thailand, Vietnam or Eastern part of central India including the east coast or China or Japan or the Pacific Rim. 
The hotspots and cloud pictures for 14 April 2017 confirm the validity of this prediction:


Extracted at 10:50 UTC on 14 April 2017.


Total number of fires detected : 1115
[ONLY TOP 5 RESULTS ARE SHOWN.]
Latitude
Longitude
Date
Time
Brightness
Confidence
Scan
Track
Satellite
Version
Bright.T31
FRP
DayNight
Type
 22.49044 
 -104.74404  
  2017-04-13  
  20:42  
  335.1 
  low  
  0.4 
 0.6  
  N  
  1.0NRT  
  305.8  
  3.0  
  D 

 22.48598 
 -104.73796  
  2017-04-13  
  20:42  
  332.1 
  low  
  0.4 
 0.6  
  N  
  1.0NRT  
  306.9  
  3.9  
  D 

 22.43033 
 -104.81883  
  2017-04-13  
  20:42  
  350.2 
  nominal  
  0.3 
 0.6  
  N  
  1.0NRT  
  303.5  
  4.6  
  D 

 22.42468 
 -104.82249  
  2017-04-13  
  20:42  
  346.0 
  nominal  
  0.3 
 0.6  
  N  
  1.0NRT  
  305.3  
  4.6  
  D 

 22.42502 
 -104.81902  
  2017-04-13  
  20:42  
  333.8 
  low  
  0.3 
 0.6  
  N  
  1.0NRT  
  305.3  
  4.6  
  D 


Total number of fires detected : 4514
[ONLY TOP 5 RESULTS ARE SHOWN.]
Latitude
Longitude
Date
Time
Brightness
Confidence
Scan
Track
Satellite
Version
Bright.T31
FRP
DayNight
Type
 14.05421 
 -10.27791  
  2017-04-13  
  02:48  
  322.9 
  nominal  
  0.3 
 0.6  
  N  
  1.0NRT  
  294.7  
  4.0  
  N 

 14.05359 
 -10.27467  
  2017-04-13  
  02:48  
  305.3 
  nominal  
  0.3 
 0.6  
  N  
  1.0NRT  
  293.6  
  4.0  
  N 

 14.0497 
 -10.28251  
  2017-04-13  
  02:48  
  367.0 
  nominal  
  0.3 
 0.6  
  N  
  1.0NRT  
  302.0  
  12.4  
  N 

 14.04913 
 -10.27956  
  2017-04-13  
  02:48  
  353.8 
  nominal  
  0.3 
 0.6  
  N  
  1.0NRT  
  296.6  
  4.0  
  N 

 14.05026 
 -10.28542  
  2017-04-13  
  02:48  
  311.4 
  nominal  
  0.3 
 0.6  
  N  
  1.0NRT  
  293.7  
  12.4  
  N 


Total number of fires detected : 2748
[ONLY TOP 5 RESULTS ARE SHOWN.]
Latitude
Longitude
Date
Time
Brightness
Confidence
Scan
Track
Satellite
Version
Bright.T31
FRP
DayNight
Type
 18.65016 
 84.06375  
  2017-04-13  
  07:12  
  348.5 
  nominal  
  0.4 
 0.5  
  N  
  1.0NRT  
  308.8  
  15.6  
  D 

 18.60606 
 83.80315  
  2017-04-13  
  07:12  
  343.8 
  nominal  
  0.4 
 0.5  
  N  
  1.0NRT  
  310.5  
  6.8  
  D 

 18.4557 
 82.86184  
  2017-04-13  
  07:12  
  336.6 
  low  
  0.5 
 0.5  
  N  
  1.0NRT  
  308.3  
  1.7  
  D 

 18.35698 
 82.2716  
  2017-04-13  
  07:12  
  341.8 
  low  
  0.5 
 0.5  
  N  
  1.0NRT  
  314.4  
  4.7  
  D 

 18.01731 
 80.5228  
  2017-04-13  
  07:12  
  343.0 
  nominal  
  0.4 
 0.6  
  N  
  1.0NRT  
  310.2  
  2.4  
  D


Total number of fires detected : 4676
[ONLY TOP 5 RESULTS ARE SHOWN.]
Latitude
Longitude
Date
Time
Brightness
Confidence
Scan
Track
Satellite
Version
Bright.T31
FRP
DayNight
Type
 24.049 
 97.4145  
  2017-04-13  
  07:12  
  367.0 
  nominal  
  0.3 
 0.6  
  N  
  1.0NRT  
  310.9  
  31.8  
  D 

 23.59756 
 93.18092  
  2017-04-13  
  07:12  
  344.3 
  nominal  
  0.5 
 0.4  
  N  
  1.0NRT  
  307.0  
  43.9  
  D 

 24.04385 
 97.41429  
  2017-04-13  
  07:12  
  341.2 
  nominal  
  0.3 
 0.6  
  N  
  1.0NRT  
  299.1  
  31.8  
  D 

 23.5982 
 93.18634  
  2017-04-13  
  07:12  
  367.0 
  nominal  
  0.5 
 0.4  
  N  
  1.0NRT  
  316.0  
  43.9  
  D 

 23.74247 
 94.47382  
  2017-04-13  
  07:12  
  338.2 
  nominal  
  0.4 
 0.5  
  N  
  1.0NRT  
  307.0  
  3.1  
  D 


Total number of fires detected : 3461
[ONLY TOP 5 RESULTS ARE SHOWN.]
Latitude
Longitude
Date
Time
Brightness
Confidence
Scan
Track
Satellite
Version
Bright.T31
FRP
DayNight
Type
 42.76471 
 129.26343  
  2017-04-13  
  17:54  
  295.4 
  nominal  
  0.5 
 0.5  
  N  
  1.0NRT  
  270.0  
  1.1  
  N 

 42.77942 
 129.3204  
  2017-04-13  
  17:54  
  296.3 
  nominal  
  0.5 
 0.5  
  N  
  1.0NRT  
  267.2  
  0.8  
  N 

 42.89207 
 129.7797  
  2017-04-13  
  17:54  
  337.7 
  nominal  
  0.5 
 0.5  
  N  
  1.0NRT  
  273.9  
  4.3  
  N 

 44.14314 
 129.25732  
  2017-04-13  
  17:54  
  320.1 
  nominal  
  0.4 
 0.5  
  N  
  1.0NRT  
  277.3  
  2.2  
  N 

 44.14725 
 129.25926  
  2017-04-13  
  17:54  
  295.2 
  nominal  
  0.4 
 0.5  
  N  
  1.0NRT  
  276.3  
  0.7  
  N 

Total number of fires detected : 3482
[ONLY TOP 5 RESULTS ARE SHOWN.]
Latitude
Longitude
Date
Time
Brightness
Confidence
Scan
Track
Satellite
Version
Bright.T31
FRP
DayNight
Type
 21.68337 
 99.10386  
  2017-04-13  
  05:30  
  353.8 
  nominal  
  0.8 
 0.8  
  N  
  1.0NRT  
  292.4  
  18.1  
  D 

 22.20509 
 98.83216  
  2017-04-13  
  05:30  
  333.4 
  nominal  
  0.8 
 0.8  
  N  
  1.0NRT  
  290.3  
  100.6  
  D 

 22.32623 
 98.97704  
  2017-04-13  
  05:30  
  367.0 
  nominal  
  0.8 
 0.8  
  N  
  1.0NRT  
  295.9  
  112.6  
  D 

 22.32827 
 98.98498  
  2017-04-13  
  05:30  
  353.6 
  nominal  
  0.8 
 0.8  
  N  
  1.0NRT  
  291.5  
  112.6  
  D 

 22.32439 
 98.96986  
  2017-04-13  
  05:30  
  347.6 
  nominal  
  0.8 
 0.8  
  N  
  1.0NRT  
  290.8  
  149.5  
  D 


CLOUD COVER OVER THE GLOBE
http://satellite.imd.gov.in/insat.htm


1 March 2017  08: 24 UTC 
The peak magnitude damquake for March 2017 is expected to be  of moment magnitude 8.1 MM and to occur between 13 and 19 March 2017. The candidate locations are the Rift valley, Western Turkey, the Himalayas, Myanmar,Thailand, Vietnam or Eastern part of central India including the east coast or China or Japan or the Pacific Rim.

12 February 2017 13:17 UTC


Prediction of the peak magnitude damquake for February 2017 is picked up from the following table. It is expected to be 6.9-7.6 MM between 12th to 18th February 2017. The long time average for the prediction is working because of the repetitive action of the rains in filling up the dams during the monsoons and emptying them in the dry season in accordance with water demand.
The expected location: Pacific Rim or the Himalayas.
See how the world's dams are causing earthquakes and collateral damage at:
 http://predictingquakes.blogspot.in/2015/04/the-science-of-dams-causing-earthquakes.html
The table of predictions:

https://blogger.googleusercontent.com/img/b/R29vZ2xl/AVvXsEh-pK3GMtRl8MXO2aR5VHeoxrNwSp5-kPNgnVNsanmeVY2oZdIG2alnkMNDjCvuE74s1gnOaPtk5Sa5xIehqebkvUdnZtz_hwNtoml4YI44h_FQRt3nj4RtTFurDEFqsaacW2Fzsw/s1600-h/image004.gif

  18 January 2017 11:43 UTC
Earthquakes in Central Italy near Rome due to dams of the world:
See exacerbation of hotspots on the 13 deg long:
Total number of fires detected : 4214
[ONLY TOP 5 RESULTS ARE SHOWN.]

LatitudeLongitudeDateTimeBrightnessConfidenceScanTrackSatelliteVersionBright.T31FRPDayNightType
 10.11255  11.88354    2017-01-17    01:18    310.5   nominal    0.4  0.6    N    1.0NRT    290.1    0.0    N 
 10.11205  11.88614    2017-01-17    01:18    312.9   nominal    0.4  0.6    N    1.0NRT    290.4    0.0    N 
 9.8284  13.3434    2017-01-17    01:18    303.6   nominal    0.5  0.7    N    1.0NRT    290.8    0.0    N 
 10.10669  11.88374    2017-01-17    01:18    304.6   nominal    0.4  0.6    N    1.0NRT    288.7    0.0    N 
 10.10612  11.88675    2017-01-17    01:18    304.7   nominal    0.4  0.6    N    1.0NRT    290.1    0.0    N 

The earthquakes:
 2017-01-18   10:25:25.01hr 16min ago

42.49 N  13.31 E  95.3 CENTRAL ITALY


F2017-01-18   10:24:16.31hr 17min ago42.60 N  13.17 E  104.5 CENTRAL ITALY


F2017-01-18   10:16:39.51hr 25min ago42.55 N  13.28 E  114.6 CENTRAL ITALY


F2017-01-18   10:15:33.21hr 26min ago42.53 N  13.29 E  104.7 CENTRAL ITALY
262
V2017-01-18   10:14:10.81hr 28min ago42.53 N  13.28 E  95.7 CENTRAL ITALY


F2017-01-18   09:52:11.81hr 49min ago42.91 N  13.13 E  83.2 CENTRAL ITALY
408
V2017-01-18   09:25:41.32hr 16min ago42.55 N  13.26 E  95.3 CENTRAL ITALY
(EMSC)
10 January 2017 at 06:53 UTC
A major deep focus damquake(earthquake caused by dams) has occurred in the Celebes Sea:
2017-01-10   06:13:47.9

4.44 N  122.64 E  626  7.3 CELEBES SEA
(EMSC)

M 7.3 - 188km SSE of Tabiauan, Philippines

Time
Location
4.463°N 122.575°E
Depth
612.7 km
(USGS)
2 January 2017 at 1426 UTC
The peak magnitude earthquake(damquake) for January 2017 is expected to be of moment magnitude  7.7 between 11 to 17 January 2017.
The candidate locations are the Himalayas, the Pacific Rim, China and Indonesia.

17 December 2016 at 11:38 UTC
A great earthquake has occurred at Papua New Guinea on 17 December 2016:
2016-12-17   10:51:11.7 43min ago
4.52 S    153.46 E    100  8.0   NEW IRELAND REGION, P.N.G. Source:EMSC
 This is as predicted for the peak magnitude earthquake for December 2016(See below)

2 December 2016 at 0706 UTC and 5 December 2016 13 UTC:
The peak magnitude earthquake(damquake) for December 2016 is expected to be of moment magnitude  8.7 between 09 to 16 December 2016.
The candidate locations are the Himalayas, the Pacific Rim, China and Indonesia.
See Web Fire Mapper for 5 December at 13z:


Look at the hotspots in this region(Africa):

Total number of fires detected : 7114
[ONLY TOP 5 RESULTS ARE SHOWN.]
Latitude
Longitude
Date
Time
Brightness
Confidence
Scan
Track
Satellite
Version
Bright.T31
FRP
DayNight
Type
 4.97694 
 25.5471  
  2016-12-04  
  23:48  
  301.6 
  nominal  
  0.4 
 0.4  
  N  
  1.0NRT  
  287.9  
  0.0  
  N 

 5.60842 
 24.6772  
  2016-12-04  
  23:48  
  306.3 
  nominal  
  0.4 
 0.4  
  N  
  1.0NRT  
  289.2  
  0.0  
  N 

 5.85741 
 25.11369  
  2016-12-04  
  23:48  
  309.8 
  nominal  
  0.4 
 0.4  
  N  
  1.0NRT  
  290.0  
  0.0  
  N 

 5.86128 
 25.11074  
  2016-12-04  
  23:48  
  306.1 
  nominal  
  0.4 
 0.4  
  N  
  1.0NRT  
  289.9  
  0.0  
  N 

 5.39202 
 28.15054  
  2016-12-04  
  23:48  
  300.5 
  nominal  
  0.5 
 0.4  
  N  
  1.0NRT  
  289.7  
  0.0  
  N 


Thus the following regions empirically are candidates for the peak magnitude earthquake in December 2016:

5,25; 25,115; 35,119. That is Africa, Europe(going up the latitude) and  China.

Look at Australia:
Total number of fires detected : 3533
[ONLY TOP 5 RESULTS ARE SHOWN.]
Latitude
Longitude
Date
Time
Brightness
Confidence
Scan
Track
Satellite
Version
Bright.T31
FRP
DayNight
Type
 -18.89023 
 141.92505  
  2016-12-04  
  15:30  
  320.5 
  nominal  
  0.5 
 0.4  
  N  
  1.0NRT  
  297.9  
  0.0  
  N 

 -18.86317 
 141.81856  
  2016-12-04  
  15:30  
  334.2 
  nominal  
  0.5 
 0.4  
  N  
  1.0NRT  
  297.8  
  0.0  
  N 

 -18.88921 
 141.9224  
  2016-12-04  
  15:30  
  314.6 
  nominal  
  0.5 
 0.4  
  N  
  1.0NRT  
  297.4  
  0.0  
  N 

 -18.86359 
 141.8204  
  2016-12-04  
  15:30  
  333.6 
  nominal  
  0.5 
 0.4  
  N  
  1.0NRT  
  297.7  
  0.0  
  N 

 -18.87477 
 141.9059  
  2016-12-04  
  15:30  
  314.1 
  nominal  
  0.5 
 0.4  
  N  
  1.0NRT  
  297.4  
  0.0  
  N 


And going up the longitude we have on the Pacific Rim, Japan(See web fire mapper above). Applying the precautionary principle appreciate the fact that Fukushima melting was caused by a DAMquake of 9 MM moment magnitude, meaning it was caused by the dams of the world. See some events and comments thereon regarding Fukushima the extinction breeder:
http://enenews.com/urgent-emergency-at-fukushima-after-rocked-by-m7-4-quake-tsunami-wave-hits-destroyed-nuclear-plants-cooling-systems-at-reactor-failed-prime-minister-we-must-grasp-extent-of-damage-ex
 For the remedy for modern civilization which is destroying itself by fake news and wrong actions see
http://collateralsofclimatechange.blogspot.in/2015/12/thinking-outside-box-trees-for-dams.html
For disregarding evidence regarding the suicidal action of the dams of the world and its consequences see
http://collateralsofclimatechange.blogspot.in/2015/11/tamilnadu-flood-during-north-east.html and all references therein  for evidence enough for man to abandon modern civilization NOW.


15 November 2016 at 05:22 UTC
The prediction for the peak magnitude earthquake has been realised on the Pacific Rim:
2016-11-13   11:02:58.4

42.69 S  172.97 E  10 7.9  SOUTH ISLAND OF NEW ZEALAND

2 November 05:03 UTC
The peak magnitude earthquake(damquake) for November is expected of moment magnitude  7.9 between 14 to 21 November 2016.
See
https://blogger.googleusercontent.com/img/b/R29vZ2xl/AVvXsEh-pK3GMtRl8MXO2aR5VHeoxrNwSp5-kPNgnVNsanmeVY2oZdIG2alnkMNDjCvuE74s1gnOaPtk5Sa5xIehqebkvUdnZtz_hwNtoml4YI44h_FQRt3nj4RtTFurDEFqsaacW2Fzsw/s1600-h/image004.gif

The candidate locations are the Himalayas, China, Central Italy and the Pacific Rim.  


See the FIRMS Web Fire Mapper data:
The maximum number of fires at 0547 hrs UTC on 10 Nov 2016 is:
Total number of fires detected : 4266
[ONLY TOP 5 RESULTS ARE SHOWN.]

LatitudeLongitudeDateTimeBrightnessConfidenceScanTrackSatelliteVersionBright.T31FRPDayNight
 29.18449  76.00092    2016-11-09    21:24    303.0   nominal    0.5  0.7    N    1.0NRT    285.6    0.0    N 
 29.56292  74.64453    2016-11-09    21:24    295.2   nominal    0.4  0.6    N    1.0NRT    283.6    0.0    N 
 29.55961  74.642    2016-11-09    21:24    301.1   nominal    0.4  0.6    N    1.0NRT    283.7    0.0    N 
 30.0498  73.56002    2016-11-09    21:24    300.9   nominal    0.3  0.6    N    1.0NRT    283.8    0.0    N 
 30.04881  73.5595    2016-11-09    21:24    297.2   nominal    0.3  0.6    N    1.0NRT    283.9    0.0    N 


The maximum number of fires at 05:46 UTC on 5 November 2016 are at:


Total number of fires detected : 3572
[ONLY TOP 5 RESULTS ARE SHOWN.]

LatitudeLongitudeDateTimeBrightnessConfidenceScanTrackSatelliteVersionBright.T31FRPDayNight
 30.5729  76.92383    2016-11-04    21:18    297.4   nominal    0.4  0.6    N    1.0NRT    285.1    0.0    N 
 30.57286  76.92112    2016-11-04    21:18    295.6   nominal    0.4  0.6    N    1.0NRT    284.9    0.0    N 
 31.25011  76.92946    2016-11-04    21:18    296.0   nominal    0.4  0.6    N    1.0NRT    284.1    0.0    N 
 31.25761  76.92619    2016-11-04    21:18    297.9   nominal    0.4  0.6    N    1.0NRT    284.4    0.0    N 
 32.38779  72.14411    2016-11-04    21:18    304.6   nominal    0.4  0.5    N    1.0NRT    290.5    0.0    N 

3 October 2016 at 04:39 hrs UTC
The peak magnitude damquake for October is expected of moment magnitude 7.8 MM between 15 to 21 October 2016. The likely candidates for the epicenter are the Pacific Rim, the Himalayas or China.
See for example:
http://www.bloomberg.com/news/articles/2016-10-02/heightened-earthquake-alert-issued-for-southern-california
and
http://www.imd.gov.in/pages/earthquake_prelim.php

4 September 2016 at 04:29 UTC
The peak magnitude damquake for September 2016  is expected of magnitude 7.9 or greater between 11th to 18th September 2016 on the Pacific Rim or China or in the Himalayas. 


20 August 2016 at 04:25 UTC
As expected there has been a major earthquake on 19 August 2016:
2016-08-19   07:32:23.0

55.33   S    31.97   W    10   7.4   SOUTH GEORGIA ISLAND REGION


12August 2016 at 12:50 UTC
A 7.7 MM magnitude earthquake is expected between 14th to 20th August 2016 either in the Pacific Rim Region or in the Himalayas.
There has been a major earthquake in the Pacific Rim Region today:
2016-08-12   01:26:36.4

22.49 S  173.09 E    20  7.1   SOUTHEAST OF LOYALTY ISLANDS

30 July 2016 at 05:24 UTC
As predicted by me on 1 July 2016, a 7.7 MM magnitude earthquake occurred in the Pacific Rim Region:
2016-07-29   21:18:30.4

18.58 N  145.51 E  269  7.7 PAGAN REG., N. MARIANA ISLANDS


Notice the cloud cover over India on 29 July 2016 surrounding the centre of gravity of the world's dam contents at 21.5, 81.5: Dams are controlling rainfall, including the All India Rains which flooded many parts of India on 29th July 2016:


See The science of dams causing earthquakes and climate change at
http://predictingquakes.blogspot.in/2015/04/the-science-of-dams-causing-earthquakes.html


16 July 2016 at 04:54 UTC
Looking at the clouds on the Himalayan arc, one sees the hotspots beneath them!
Grim foreboding for a major quake.


5 July 2016 at 11:39 UTC
Look at the eye of the South West Monsoon over India at the centre of gravity of the world's dams at 21.7, 81.7:


1 July 2016 at 05:15 UTC
The peak magnitude earthquake for July is expected to be of 7.7 MM magnitude between 16th to 22nd July 2016. The likely candidates for the location: Pacific Rim, The Himalayas. The surges of the dams of the world is the cause.
There have been cloudbursts in Uttarakhand which killed 9 people. See how the clouds are clustered around the centre of gravity(22,82.6) of the world's reservoirs behind the dams:


28 June 2016 at 15:11 UTC 

Heavy rains resulted in floods in China and loss of lives. Also forest fires blazed in Southern California. Applying the precautionary principle, these were caused by the dam surges of hundreds of thousands of terawatts of power as the south west monsoon progressed and there were surges of changes in world dam contents.
Cloud cover over India is hovering around the center of gravity of dams as of 27 June 2016 at 22.35, 82.65:
http://satellite.imd.gov.in/insat.htm 
While San Andreas fault is near the California forest blazes(83 km away), the dam surges at present are unable to crack the tough nut that San Andreas fault is, but are able to cause floods and forest fires.

We should watch out for the faults like San Andreas as the monsoon progresses and dam content changes reach a cresendo in the coming days.